PRODUCTS
- iTracker
- iUploader
- iAnalytics
- iDiscovery
- iDesigner
- iCE
- iCare
iTracker
Automated Bio Specimen Management for Clinical Trial Managers
Quick reconciliation of bio specimen collection and shipment.
Real-time bio specimen tracking across the clinical trial site
Customized search and report on all data points.
What is iTracker
iTracker automates the sample tracking process by integrating data generated from sample collection and analysis activities from the various organization.
Who is it for
Study managers, clinical operation managers, clinical research coordinators, scientists, clinical investigators, clinicians, oncologists, cancer researchers, principal investigators, lab personnel, bioinformaticians
Challenges
Clinical trial ’s complex ecosystem involves multiple medical centres, hospitals, bio-specimen vendors, sites, and CROs located across the globe – making it extremely difficult to organize, assemble, and track data according to a unified classification scheme.
Strict regulatory scrutiny, changing legal requirements, and different trial guidelines across geographical regions introduce additional layers of complexity.
In order to ensure that all the stakeholders get due credit for their intellectual and financial capital invested, it is very important to maintain accurate tracking and annotation of data.
Lost, compromised, and unannotated data can prevent retrospective analysis that may prove to be critical in more advanced phases of clinical trial pipeline
Solution
iTracker automates sample tracking process by integrating data from the various organizations. The platform offers a high level of automation in tracking clinical samples and consent documents during the entire trial period.
This solution is currently used by the Parker Institute for Cancer Immunotherapy to manage its sample tracking operations across 6 different institutes in the United States.
It empowers study teams to monitor the health of clinical trials from a sample-centric perspective across the distributed ecosystem of sites, labs, vendors, and biobanks.
Most clinical trials can be configured with out-of-the-box (OOB) features and do not require any special customization – making it very easy to bring on new studies and data sources from vendors.
Key Features
Dedicated sample-centric informatics infrastructure provides real-time intelligence and decision support by combining key clinical trial processes/operations in a single platform.
Real-time sample collection status and actionable insights into study planning (including sample collection and informed consent).
Streamlined automation of patient enrollment & consent tracking.
Seamless sample collection, shipment, and reconciliation.
Monitor sample storage, transfer requests, the fulfillment of transfer requests, and sample inventory.
iUploader
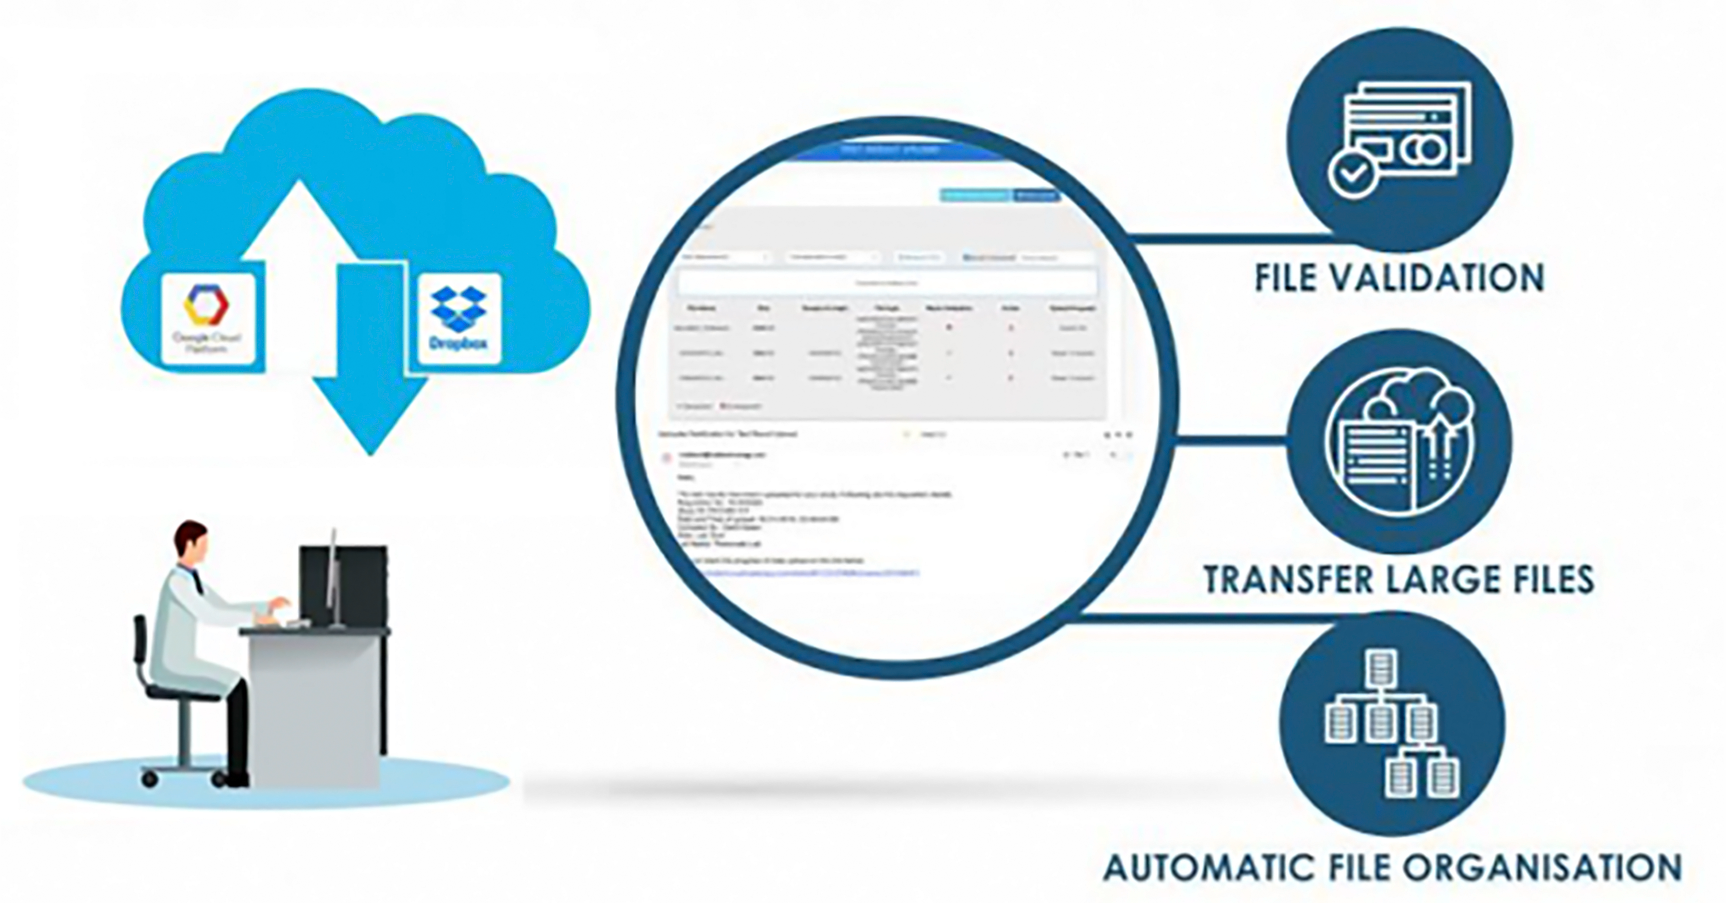
Rapid Upload of Multi-Dimensional Data with Ease on a Cloud-Based Data Lake.
Automated process free from manual errors.
Customized data architecture for easy querying
Automated data QC & data validation for error detection
What is iUploader
An application that helps the user to quickly and easily upload and organize multi-dimensional data on a cloud-based data lake. The application includes built-in quality control criteria which allow users to check the conformity of data.
Who is it for
Study managers, clinical operation managers, clinical research coordinators, scientists, clinical investigators, clinicians, oncologists, cancer researchers, principal investigators, lab personnel, bioinformaticians
Challenges
As the target lead or a therapeutic combination moves from preclinical testing to more advanced phases of clinical trials investigators invariably generate increasingly large and complex data sets. The depth and breadth of this information can get infinitely large and complex as multiple data points start pouring in from several sources. For instance, sequencing data alone can require several gigabytes (GB) of storage making it impossible for the user analyzed the data on personal computers
Since a large majority of clinical trials are conducted in medical centres located across the globe, it becomes increasingly challenging to organize and assemble data according to a unified classification scheme. This also generates the need for multiple iterations of data entry, downloads, uploads, and analysis within variable clinical trial management informatics platforms globally dispersed across many medical centres. This can lead to mistakes in labelling, tracking, storage, analysis, and interpretation of clinical data – costing sponsors thousands of wasted man-hours and research dollars.
Mid-study changes in protocols, switching of biospecimen vendors, transfer of ongoing trials to different clinical research organizations (CROs), new scientific innovations, evolving federal authority requirements, and incompatibilities between software platforms used at medical centres can compound these problems and can introduce long delays in the process.
Solution
iUploader is an AI-powered platform that seamlessly executes data parsing and manipulation procedures as the data is being uploaded onto the platform. It enables faster data transfers by systematically classifying and organizing information according to the type of data.
It allows laboratories, sites, vendors to upload, store, share and transfer the data in a central-cloud based repository so that researchers have instant access to raw data. The highly secure cloud-based data transfer platform offers compliance with HIPPA and 21 CFR part 11 norms.
Key Features
Automated process – eliminates manual errors and enables a dramatic reduction in time spent in uploading, sharing, transferring, and cataloging data.Organizes the data in “suited” architecture for easy querying across different assays/studies.
Performs data QC for different formats, enables data validations, and continuously monitors the conformity and regularity of the data from different sources.Highlights data inconsistencies in accordance with the defined data validation & QC standards.
Generates detailed reports for every upload – streamlining the flow, monitoring, and management of data.
System generated email alerts at each step during uploads intimating the users regarding the status of the data transfer operations.
Interactive and real-time dashboards showing data transfer operations.
Imported Data Summary & Report

iAnalytics
Revolutionary Analytics Framework Enabling you to Slice-and-Dice Data as you wish
- Slice-and-dice data for comparison and customization of experimental cohorts.
- 30 pre-configured molecular data analysis pipelines.
- Allows the creation of a library of informatics pipeline and plug-in new user pipelines for analysis
What is iAnalytics
iAnalytics is a powerful analytical framework built on auto-scalable Kubernetes cluster. Along with over 30 pre-configured molecular data analysis pipelines, it enables to plugin of any new algorithm using docker containerization. The flexible computational framework and a slice-and-dice analysis model (in contrast to batch mode) for comparing samples, enables quick and efficient creation of experimental cohorts of interest and conduct comparative analysis.
Who is it for
Study managers, clinical operation managers, clinical research coordinators, scientists, clinical investigators, clinicians, oncologists, cancer researchers, principal investigators, lab personnel, bioinformaticians
Challenges
Heterogeneity of multi-omic data makes it difficult to analyze various omics data obtained in clinical trials.
Multidimensional data requires a slice-dice-comparison model to facilitate the breakdown of complex data into manageable chunks.
Lack of scalable architecture to sustain parallel data uploading and analysis operations affect the system performance and lead to a considerable “down-time”.
Rapid advances in sequencing platforms require frequent scale-ups of informatics systems – necessitates the need for a flexible framework for plugging in new user-defined algorithms.
Solution
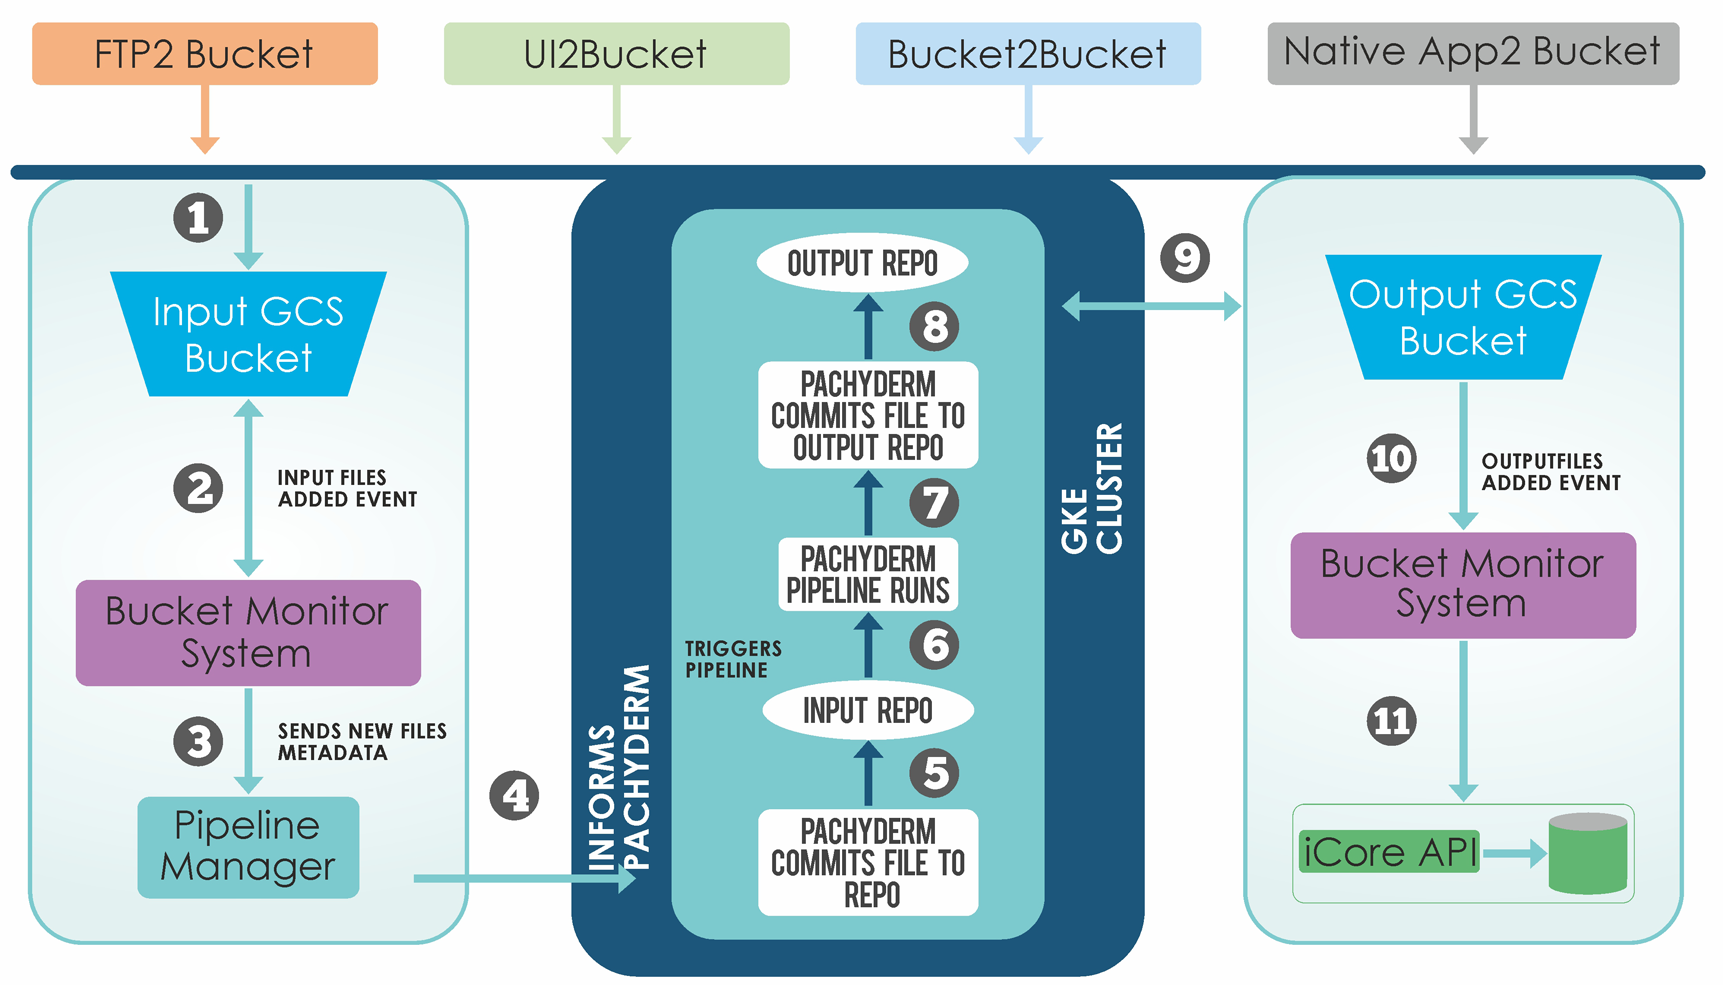
iAnalytics engine is powered by a Kubernetes cluster. This auto-scalable feature ensures that resources are balanced in accordance with the load on the system.
The iAnalytics engine also provides a framework to plug-in new algorithms and tools by creating Dockers for new resources and ensures that the system remains platform independent.
It is integrated with a job monitoring system which provides an interface for the user to monitor long running applications and provides users with appropriate logs and notifications.
Key Features
Slice-and-dice analysis (in contrast to batch mode) of the samples enables quick and efficient creation of experimental cohorts of interest and conduct comparative analysis.
An automatic data monitoring system that activates corresponding downstream pipelines and generates outputs.
30 pre-configured molecular data analysis pipelines.
Allows the creation of a library of informatics pipeline and plug-in new user pipelines for analysis.
iDiscovery
Revolutionary machine learning algorithms which let’s you jumpstart your research and begin your visual discovery. It’s a visual experience you’ll will love
Customized visual experience you’ll fall in love
The multi-layer analytics enabling rapid translation of discovery data
Generates cards for assay & clinical result
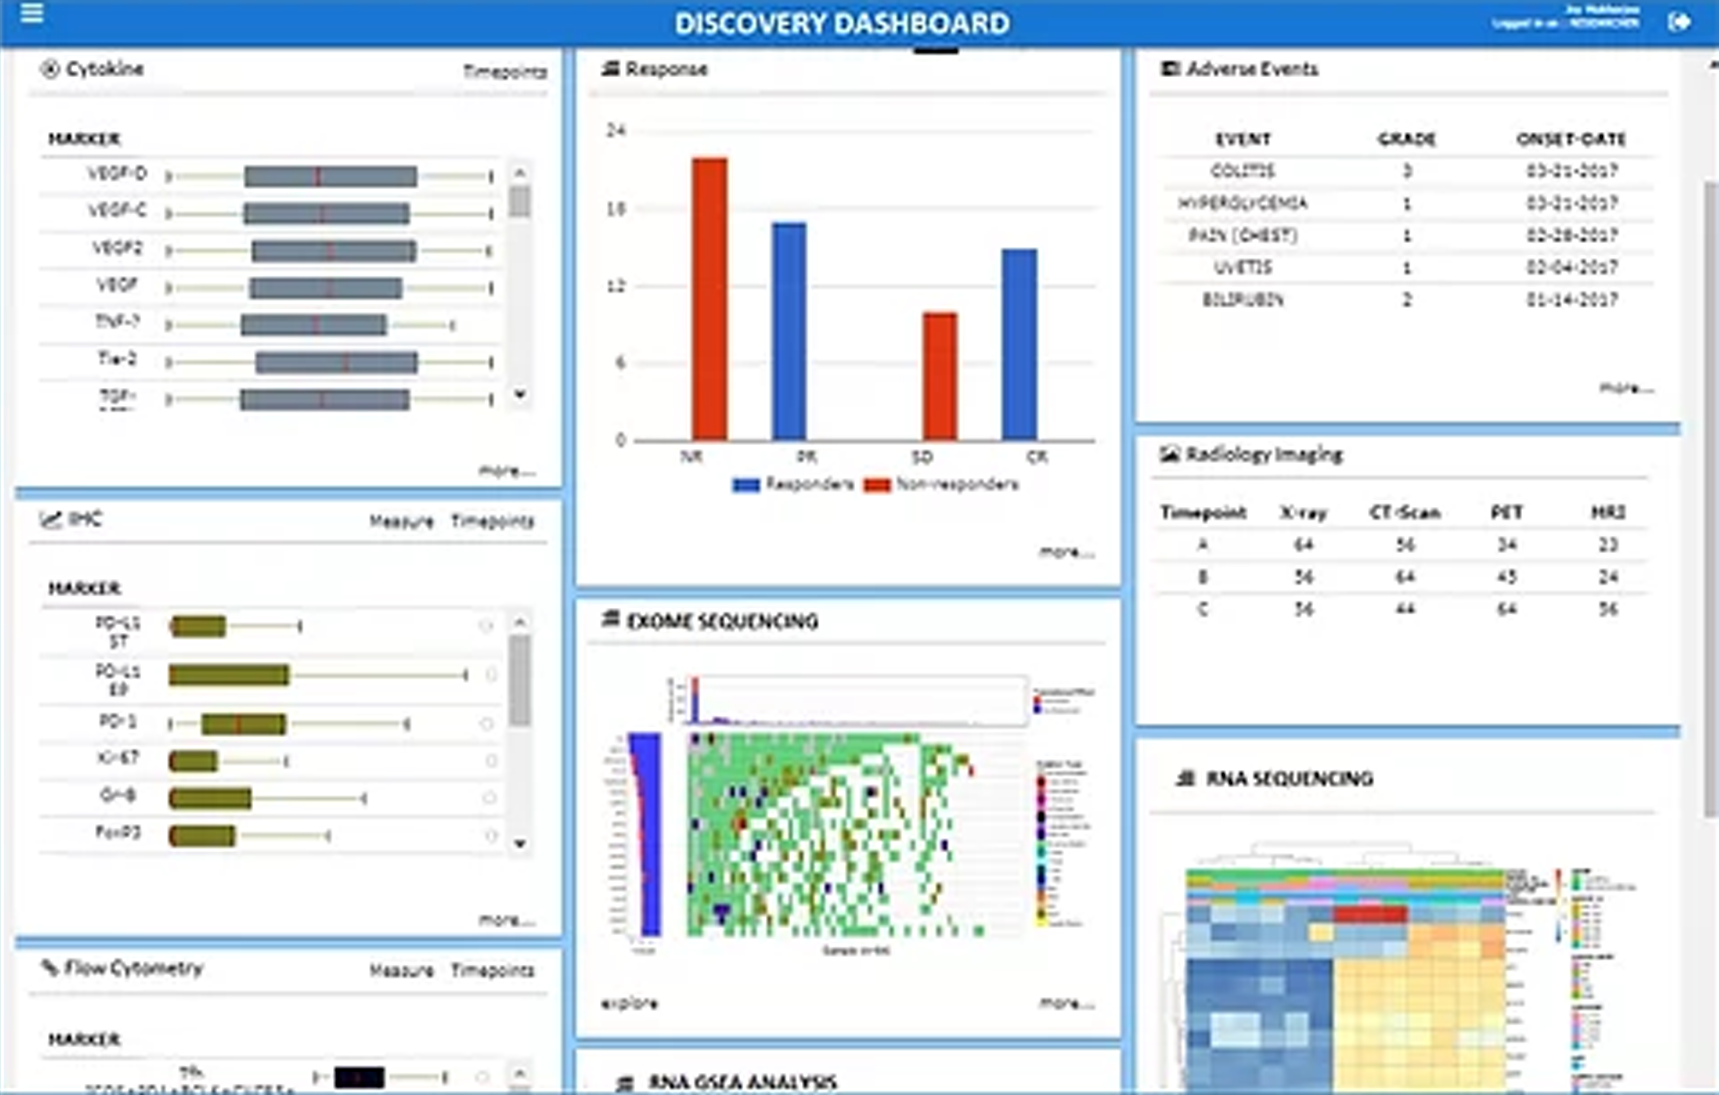
iDiscovery puts rigorous state-of-the-art machine learning algorithms, interactive data analysis tools, and intuitive visualization windows into the hands of researchers. Following the analysis, it can display the results in either a single study view (SSV) or in a single patient view (SPV). The multi-layer analysis solution allows a much cleaner interpretation of high-throughput experimental omics data in translational research.
Who is it for
Study managers, clinical operation managers, clinical research coordinators, scientists, clinical investigators, clinicians, oncologists, cancer researchers, principal investigators, lab personnel, bioinformaticians
Challenges
Translational researchers frequently struggle with cross-functional visualization of multi-dimensional clinical and omics data. Clinical researchers need to understand these associations in order to discover safer and more effective drugs. There is an unmet need to developing such tools in order to speed up correlative studies that aid in mining novel patient-centric insights.
The lack of validated biomarkers for guiding clinical trials is one of the most common problems that lead to many failures. Patient-level “omics” differences in individual tumors can lead to dramatic differences in response rate even within patients that present similarly aggressive cancer (stage, grade, the degree of metastasis etc.).
Many targeted immunotherapies are directed against a single agent or molecule. However, therapies directed against a singular molecular target can often fall short as compensatory mechanisms allow cancer cells to thrive. Such compensatory mechanisms, in many cases, reflect “omic”-level differences in susceptible individuals. Such differences can be unearthed only through pharmacogenomic studies that allow “patient-level cancer vulnerabilities” to stand out.
Solution
iDiscovery puts rigorous state-of-the-art machine learning algorithms, interactive data analysis tools, and intuitive visualization windows into the hands of researchers.
The flexible client-server architecture employs a rich set of application programming interfaces (APIs) enabling superimposition of omics data on clinical data.
Since the platform is centrally managed, secure, and scalable – it can be easily integrated into pre-existing bioinformatics environments.
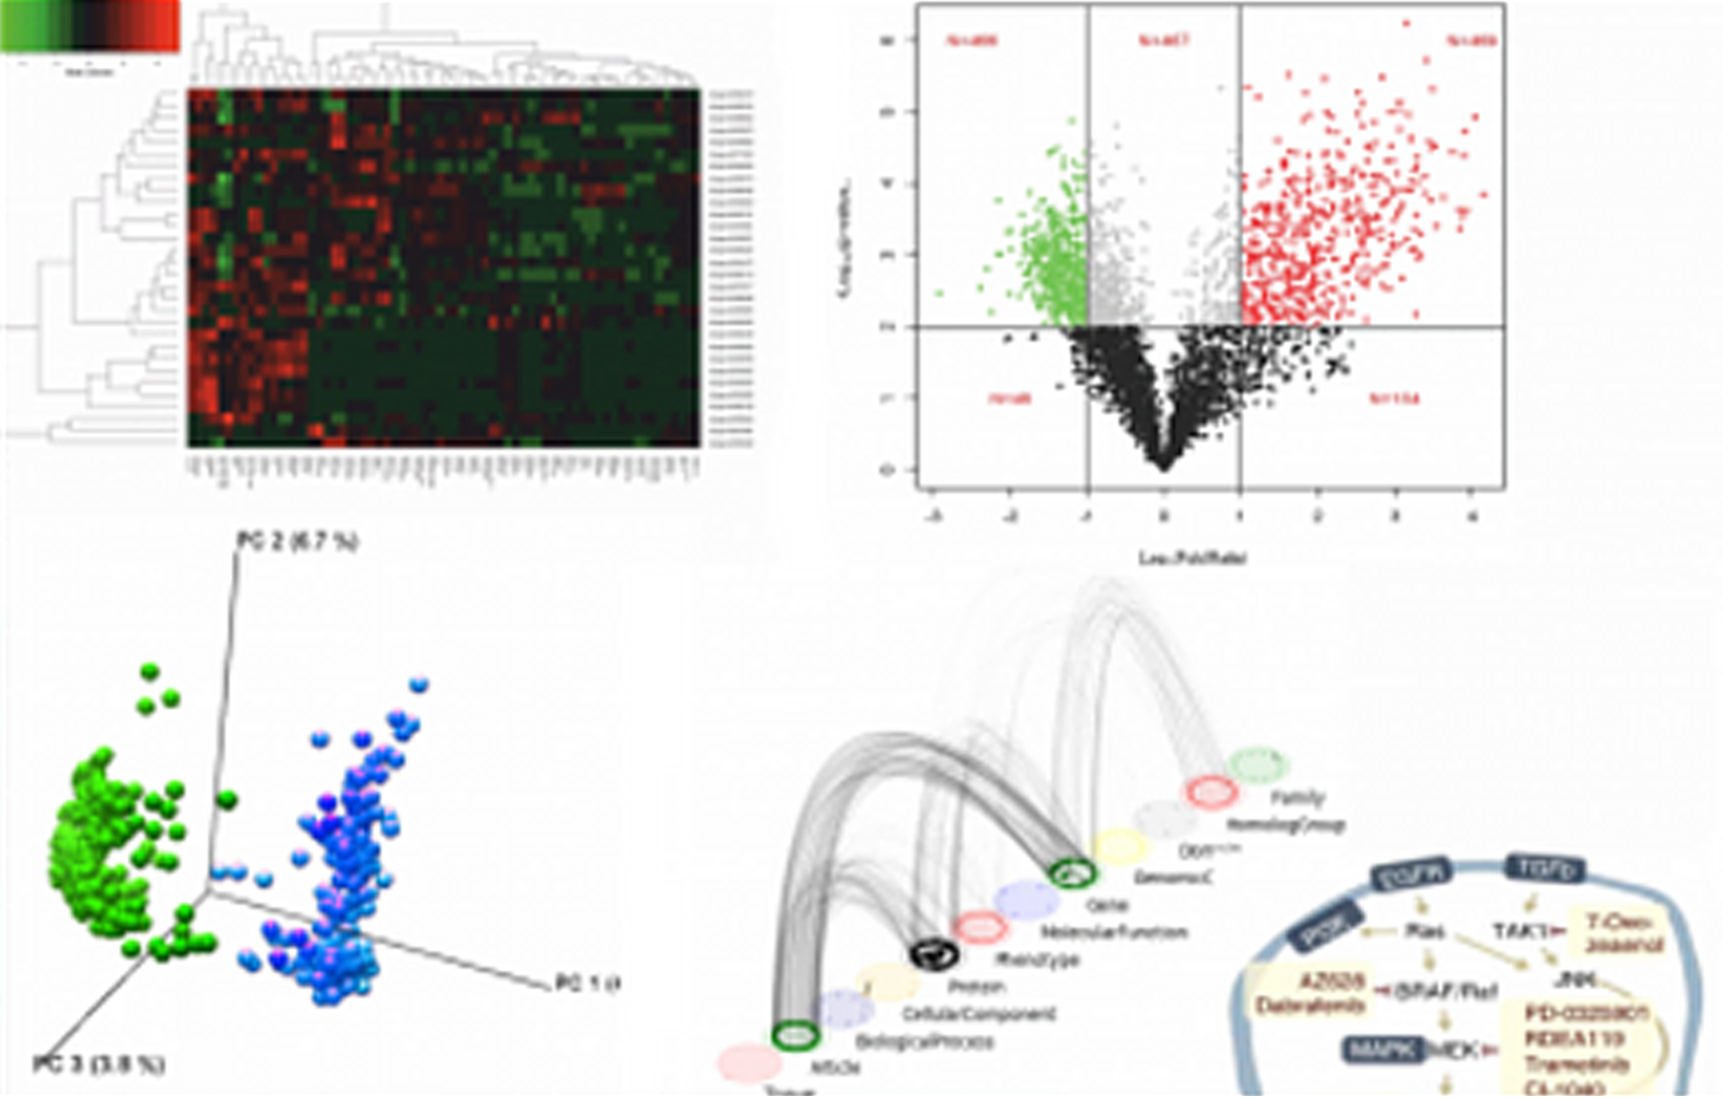
The powerful application hosts interactive data exploration and visualizations tools that are complemented with an impressive range of statistical applications (data normalization, Principal Components Analysis (PCA), heat-maps, volcano plots, boxplot, t-Test, ANOVA, predictive models etc.).
Key Features
iDiscovery streamlines biomarker discovery and validation process from multiomics and clinical datasets. Following the analysis, it can display the results in either –
a single study view (SSV), or in
a single patient view (SPV).
The multi-layer analysis solution allows a much cleaner interpretation of high-throughput experimental data in translational research.
Generates cards for assay result e.g. flow cytometry, IHC, cytokine profile, serum biomarkers, hematology data, radiology data etc.
Generates cards for clinical data and patient demographics e.g. age profile, gender distribution, primary disease, response outcomes, adverse events, tumor reduction etc
iDesigner
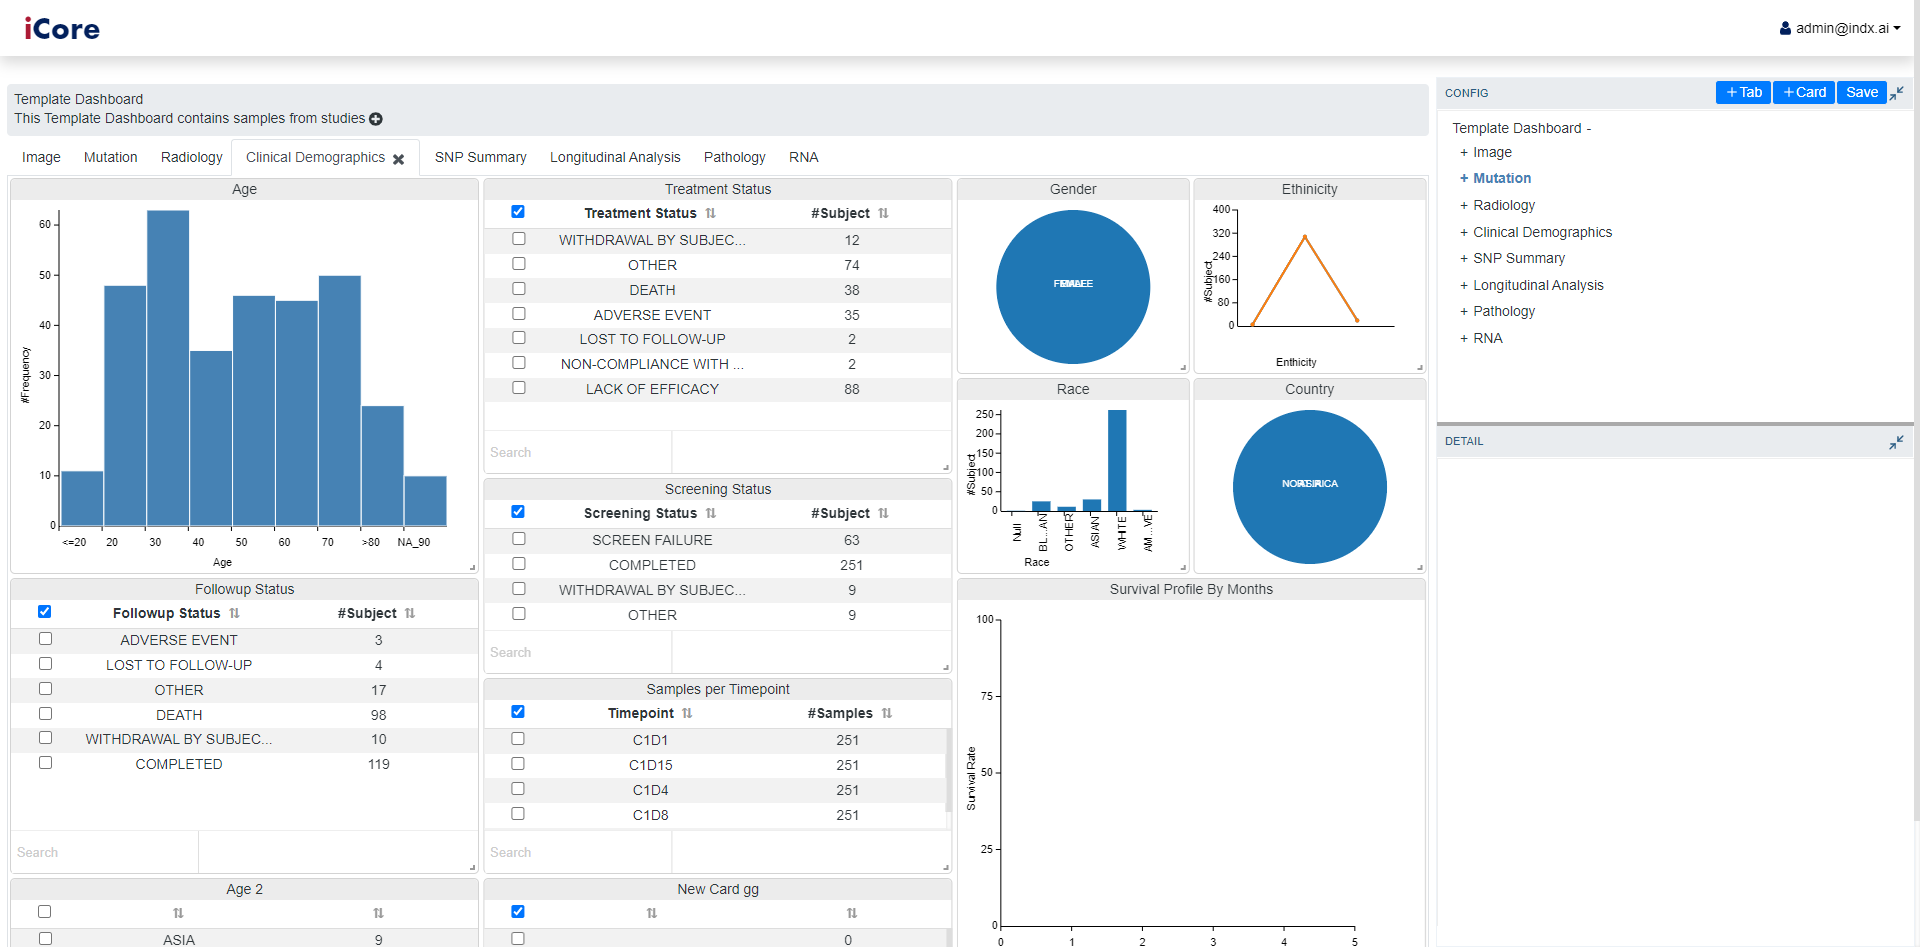
iDesigner enables the powerusers to create their own customized view of dashboard. This can be done by either changing the existing templates or creating the dashboard from scratch.
Empowers user to add new information to the dashboard as cards.
Enables changing the visializations based on one’s choice.
Facilitates user to visualize same data in different forms of charts as well as tables.
Allows rearranging, adding and/or removing cards based on the user’s intrest.
iCorrelation Engine
Intelligent data correlation that identifies discovery signatures between multi-omics and clinical datasets accelerating biomarker discovery
- Insights from omics datasets can help mine previously unexplored biomarker at specific time points and predict response to the therapy.
- Ability to run Principal component analysis (PCA), identify specific clusters of biomarkers, and identify relevant pharmacogenomics cohorts within the patient subpopulation
- Ability to conduct retrospective screening on specific time points and identify previously missed predictive biomarkers.
What is iCE
iCorrelation engine (iCE) executes AI-powered correlation and analysis of multidimensional omics and clinical data. Facilitates the biomarker discovery and patient stratification process.
Who is it for
Study managers, clinical operation managers, clinical research coordinators, scientists, clinical investigators, clinicians, oncologists, cancer researchers, principal investigators, lab personnel, bioinformaticians
Challenges
- The integrated analysis of multi-omics data is a challenging task due to the heterogeneity in the different informatics platforms used.
- Superimposition of multiomic datasets with clinical datasets is very complex and requires highly nuanced tools that can delve deeper to conduct rational and revealing correlative studies.
- Increased exploratory analysis and biomarkers screen incentivizes programs generate to acquire multi-omics data at the outset exploratory recent FDA guidelines encouraging exploratory analysis and.
- Many small-to-mid-sized pharma companies moving into the world of biomarker and exploratory trials, they lack the powerful bioinformatics tools to conduct such exploratory studies. This has led to many high profile failures of major I/O therapies trials conducted by pharma companies previously.
Solution
- By executing an AI-powered integration, organization, visualization, and analytics of multi-dimensional data; the Integrated Correlation Engine (iCE)automate the biomarker discovery process.
- iCE uses a novel data correlation models that facilitate the investigation of relationships between multi-omics and clinical outcomes datasets. This results in an improved ability to associate biomarkers with clinical phenotypes of interest.
- iCE’s statistical integrative framework can benefit a diverse range of users like researchers, oncologists, principle Investigators, and bioinformaticians involved in immuo-oncology translational studies by enabling them to conduct Module-based analysis (MBA)
- Graphical outputs greatly assist in the interpretation of complex analysis done on multiomics and clinical data. These features provide valuable biological insights and mine for patient-specific biomarkers in an unbiased manner as a function of treatment duration and dose.
- We have designed adaptors and application programming interfaces (APIs) for a wide variety of “omics” datasets such as whole exome sequencing (WES), RNA-Seq, Nanostring, T-cell receptor (TCR) Seq, qPCR, Flow Cytometry, Immunohistochemistry (IHC), Cytokine profiles, Radiology (including images), Multiplex ELISAs, LC/MS, and clinical endpoints (PET, CT, MRI) and information derived from electronic data capture (EDC)/Argus.
Key Features
- Insights from omics datasets can help mine previously unexplored biomarker at specific time points and predict response to the therapy.
- Ability to run Principal component analysis (PCA), identify specific clusters of biomarkers, and identify relevant pharmacogenomic cohorts within the patient subpopulation.
- Ability to conduct retrospective screening on specific time points and identify previously missed predictive biomarkers.

iCE Dashboard displaying a relative expression of ten different genes in three cohorts of patients (progressive disease, partial response, and stable disease). The current output shows information at a specific time point derived from an RNA-Seq experiment. Notice drop-down menus and interactive scale for adjusting a number of markers and types of analysis (modality). This enables mining of similar or new gene expression changes from other types of experimental queries. Analysis like these form a basis for quick identification of biomarker trends for a particular patient cohort (e.g. responders vs. non-responders)

iCE allows the user to normalize the data as per their requirements. Also recommends normalization parameters that will give the best results.

iCE is powered to conduct multi-omics correlation analysis enabling researchers and scientist to identify biomarkers and stratify patients according to their response and phenotype

iCE can conduct complex analysis and displaying data in several graphical outputs. Shown here are two representative graphical output format. On the left notice, a scatter plot showing a correlation between p-value and the change in gene expression measured in fold change in for a particular experiment. Shown on the right is a dot-plot distribution of samples (cohort of patients with observed metastasis)

iCE is powered to conduct principal component analysis (PCA) on multi-omics and clinical data – enabling researchers to identify powerful clusters of genes (notice marker cluster and PID cluster) associated with a particular phenotype.
iCare
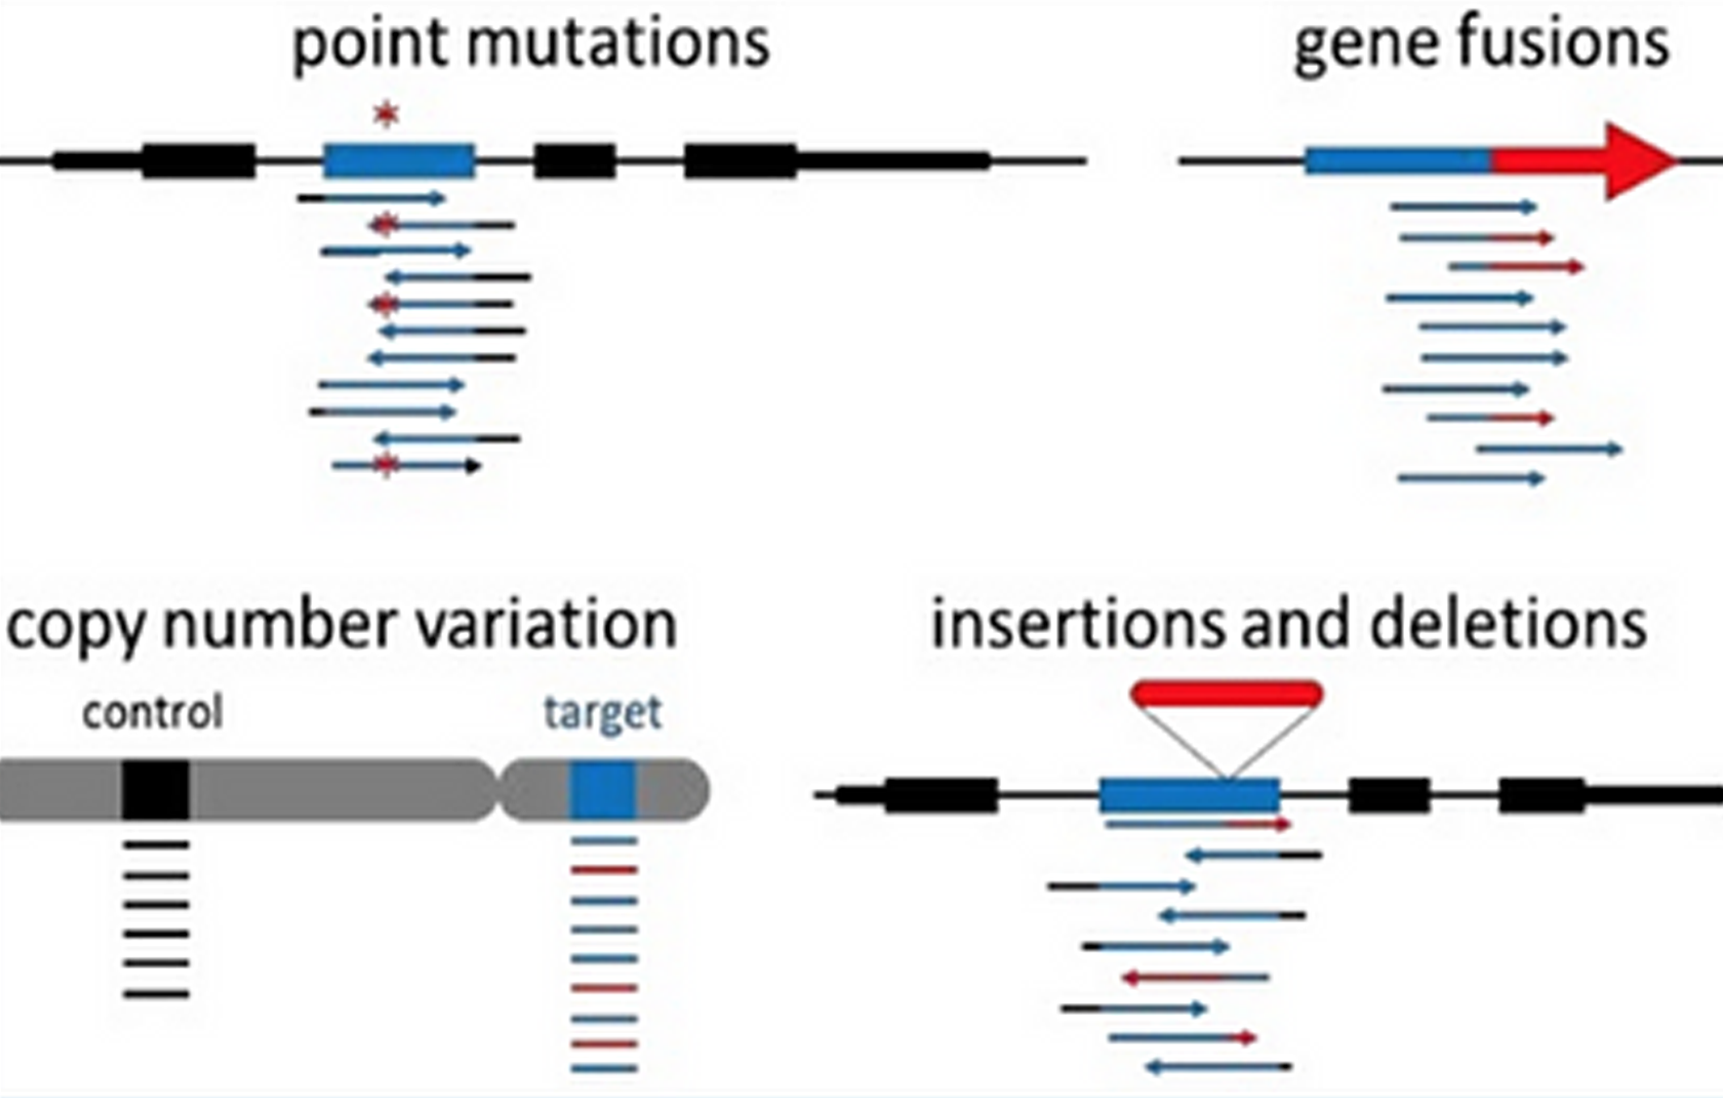
An application that facilitate cancer management by accurately detecting, annotating and classify all types of omics variants, and provides curated content from professional associated guidelines and publicly available databases.
One click end-to-end workflows for detecting and annotating variants in your samples.
Interactive patient reports provide the most useful therapies for your patient in an instant.
Multiple views allow for personalized user interface for different types of users.
Interactive charts and tables that visually provide all the information related to your disease or variant of interest.
What is iTracker
iTracker automates the sample tracking process by integrating data generated from sample collection and analysis activities from the various organization.
Who is it for
Study managers, clinical operation managers, clinical research coordinators, scientists, clinical investigators, clinicians, oncologists, cancer researchers, principal investigators, lab personnel, bioinformaticians
Challenges
Clinical trial ’s complex ecosystem involves multiple medical centres, hospitals, bio-specimen vendors, sites, and CROs located across the globe – making it extremely difficult to organize, assemble, and track data according to a unified classification scheme.
Strict regulatory scrutiny, changing legal requirements, and different trial guidelines across geographical regions introduce additional layers of complexity.
In order to ensure that all the stakeholders get due credit for their intellectual and financial capital invested, it is very important to maintain accurate tracking and annotation of data.
Lost, compromised, and unannotated data can prevent retrospective analysis that may prove to be critical in more advanced phases of clinical trial pipeline
Solution
iTracker automates sample tracking process by integrating data from the various organizations. The platform offers a high level of automation in tracking clinical samples and consent documents during the entire trial period.
This solution is currently used by the Parker Institute for Cancer Immunotherapy to manage its sample tracking operations across 6 different institutes in the United States.
It empowers study teams to monitor the health of clinical trials from a sample-centric perspective across the distributed ecosystem of sites, labs, vendors, and biobanks.
Most clinical trials can be configured with out-of-the-box (OOB) features and do not require any special customization – making it very easy to bring on new studies and data sources from vendors.
Key Features
Dedicated sample-centric informatics infrastructure provides real-time intelligence and decision support by combining key clinical trial processes/operations in a single platform.
Real-time sample collection status and actionable insights into study planning (including sample collection and informed consent).
Streamlined automation of patient enrollment & consent tracking.
Seamless sample collection, shipment, and reconciliation.
Monitor sample storage, transfer requests, the fulfillment of transfer requests, and sample inventory.


